The capacity crunch has been in effect for quite some time, but never have we seen it this tight. Trucking executives say they are rejecting record-breaking amounts of freight in what is being described as a “booming peak freight season,” Logistics Management recently reported.
What many see as issues with skyrocketing rates are actually issues with capacity. The decrease in carriers, combined with an increase in shipments, is forcing shippers to pay more for the goods they ship. Carriers are becoming more selective when it comes to the loads they are willing to haul, and it’s pushing rates past what shippers want to pay. Now, more than ever, shippers need a solid 3PL partner who can help them collaborate with carriers and create new, innovative ways to ship their products.
The Cass indices tell a compelling story
Many shippers have anecdotal evidence of the capacity crunch, but analysts have something even more concrete: data. According to the latest report by Cass Information Systems, Inc., many modes of transportation are reporting limited amounts of capacity and, in some cases, capacity at extreme price points that are stretching the budgets of shippers.
Their claim is backed fully by their reporting. The Cass Intermodal Price Index, which measures market fluctuations in per-mile intermodal freight costs, currently sits at over 142.1 and has been rising since June of this year. It’s currently on pace to hit both an annual and all-time high before the year is over. This measurement includes all costs associated with the move (linehaul, fuel and accessorials) and is based on costs as of January 2005, using a base value of 100.
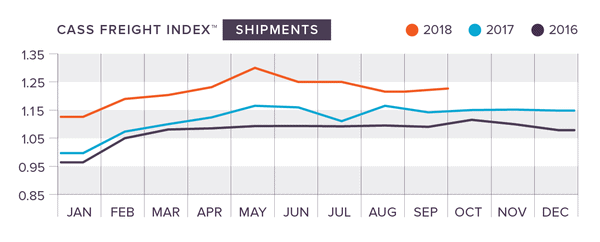
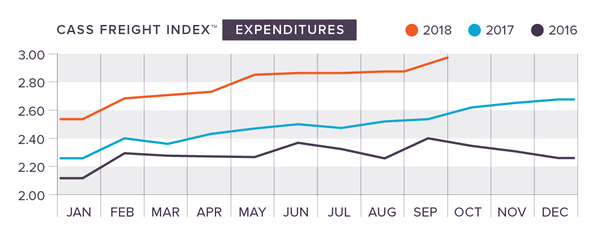
Consistent increases are also hitting both the expenditures and shipment indices, which measure the shipment volumes and expenditures in comparison to a baseline of 1.00 that was established in January, 1990. Shipments have been rising since August, and expenditures are on pace to exceed 3.00 by Thanksgiving. These indices are adjusted to provide a snapshot for an average 21-day work month.

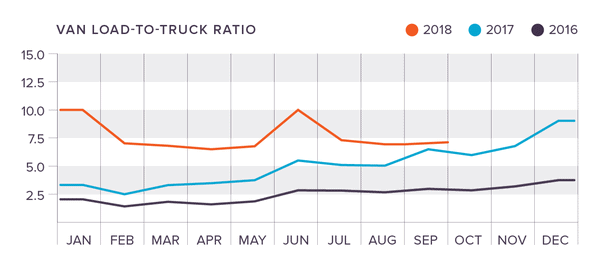
The DAT Van-to-Truckload Ratio is also on the rise, reaching 7.2 in September. In other words, 7.2 loads were available for every truck posted to the DAT load boards. This ratio is expected to exceed 10.0 by year-end.


Loosening the grip
Solving these challenges requires innovative strategies combined with streamlined execution. Shippers and 3PL companies like King Solutions take proactive measures to ensure they are doing everything they can to counter rising rates, including:
- Hauling freight with ease: At King, we make it as easy as possible for carriers to pick up and drop off freight at our facility. This includes offering after hours and weekend times for shipping and receiving, reducing dock congestion with best loading and unloading procedures, utilizing drop trailers, and properly packaging freight. Make it easy for carriers to haul your freight and you will encourage them to keep coming back to you time and again.
- Flexibility is key: trucking is not the only way to ship freight. At King, we leverage air, rail and sea transportation, helping our clients choose the best method for their needs. We also leverage multiple strategies. When full truckloads are not the best method, we help our clients coordinate LTL and PTL shipments to move their freight more efficiently.
- Thorough screening: King thoroughly vets carriers to ensure we are collaborating with reliable drivers. When looking for carriers to haul your freight, it’s important to review safety ratings, insurance policies and freight claim rates.
Finding new solutions
Our team of tenured experts thrives on creating custom logistics solutions. Ready to optimize your supply chain? Contact King today.


 Joel Rice