
Q4 delivered a period of balance across the supply chain. Economic growth exceeded expectations, freight markets steadied, and inventory discipline shaped operating behavior. Conditions settled into a clearer pattern as the year closed.
That clarity carried definition. Freight volumes softened under inventory drawdowns and late-quarter weather disruptions. Capacity tightened selectively across lanes. Rates held firm. Fuel costs offered incremental relief. These forces shaped an environment defined by control and precision as the year closed.
This quarter created a strategic opening.
Catch Up on Q3 2025 Data
Read the Q3 Logistics Industry Report
Policy Uncertainty Shapes the Growth Outlook
Late-quarter estimates reinforce Q4 growth strength. The Federal Reserve Bank of Atlanta’s GDPNow model estimates Q4 2025 real GDP growth at 5.4 percent (SAAR), reflecting resilient consumer demand and investment activity.
Inventory drawdowns and incomplete data tied to the federal government shutdown narrowed visibility entering 2026, even as economic momentum continued. Growth signals persist as policy conditions shape planning assumptions.
Consumer Confidence and Employment
Consumer confidence showed renewed volatility late in Q4. The Conference Board’s Consumer Confidence Index rose to 94.2 in December following prior weakness, reflecting a short-term improvement in sentiment as the quarter closed.
Employment data from the U.S. Bureau of Labor Statistics showed:
- Net jobs added: +50,000
- Unemployment rate: 4.4%
The distribution and fulfillment market exited Q4 with a disciplined operating stance. Inventory drawdowns and capital efficiency guided network decisions. As reported by AJOT, the market shifted toward speed and flow, prioritizing responsiveness across fulfillment operations.
Manufacturing Output
According to the Federal Reserve’s Industrial Production report, manufacturing activity stabilized during Q4 as demand held and inventories adjusted. Industrial production increased 0.4 percent in December and grew at a 0.7 percent annual rate over the quarter, with manufacturing output posting a modest December gain. Total production finished Q4 2.0 percent above prior-year levels, and capacity utilization rose to 76.3 percent, reinforcing a measured operating posture as the year closed.

Capacity and Freight Rates
DAT Van Load-to-Truck Ratio
According to DAT Freight & Analytics, van capacity tightened meaningfully as Q4 closed. The van load-to-truck ratio increased sharply in December, rising 62.5 percent month over month and standing 46.9 percent higher than December 2024. The year-end surge capped a period of sustained elevation throughout 2025, confirming that capacity exited Q4 in a structurally tighter position than prior cycles.
Capacity dynamics continue to reward structured planning.
National Spot and Contract Rates
National averages at the end of Q4:
- Van: $2.29 (Spot) | $2.46 (Contract)
- Flatbed: $2.53 (Spot) | $3.04 (Contract)
- Reefer: $2.70 (Spot) | $2.80 (Contract)
Rates remained stable across modes, with contract pricing anchoring planning decisions. Spot conditions varied by lane and equipment type, while contract premiums reflected targeted capacity pressure across transportation networks.
Freight Shipments and Expenditures
Cass data shows Q4 closing with restrained freight demand and steady cost pressure. Shipment volumes trended lower through the quarter as inventory discipline limited seasonal lift, while freight spending remained comparatively stable. Linehaul pricing held firm into year-end, pointing to a market shaped more by capacity and execution dynamics than by volume movement.


Tonnage Trends
Trucking activity edged higher late in the quarter. The ATA Tonnage Index increased 0.4 percent in December, following a 0.2 percent gain in November. Tonnage levels reflect recovery following earlier pullbacks, including a combined 2.7 percent contraction in September and October.
Freight movement continues to recalibrate across networks.
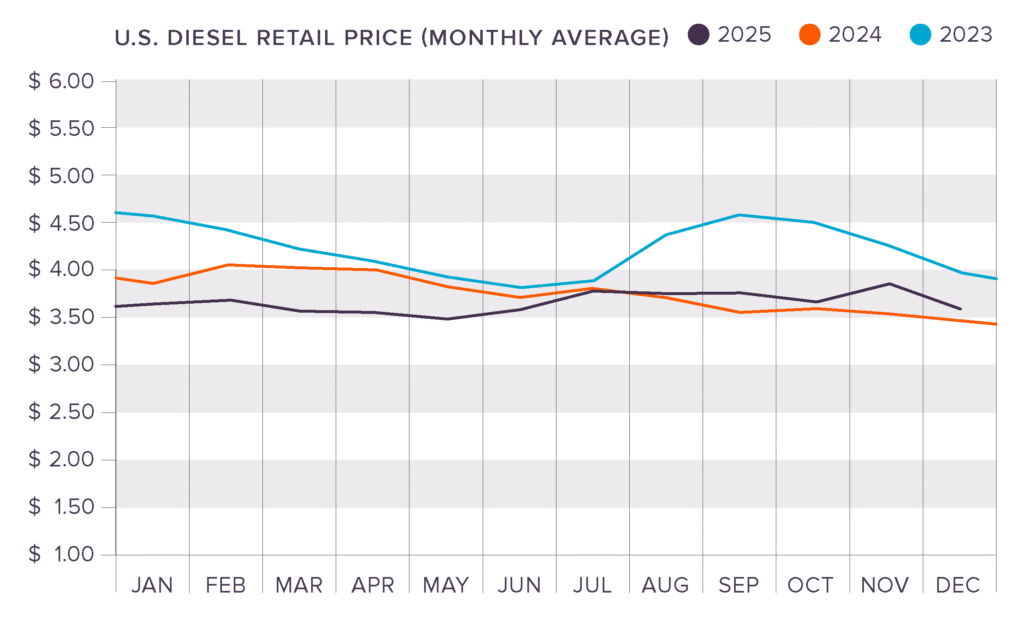
Diesel Fuel Prices
Diesel fuel prices fluctuated during Q4, ranging from $3.54 to $3.83 per gallon. As of this report, diesel sits at $3.64. Fuel costs continue to influence margin planning across transportation strategies.
Stability Under Pressure
Q4 brought clarity to a market shaped by selective pressure. Capacity remains uneven, costs have steadied, and demand reflects deliberate replenishment. Precision now defines performance. Shippers with strong visibility and disciplined execution stand ready to turn stability into advantage.
Plan Ahead with King
As the market continues to shift, now is the time to pressure-test transportation and warehousing strategies for durability. King Solutions helps shippers operate with confidence by bringing clarity and control to supply chain execution.
Let’s talk about what’s ahead.
Contact King Solutions to start the conversation.